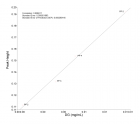
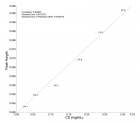
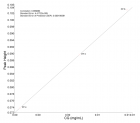
Figure 4
Determination of anthocyanin content in two varieties of Hibiscus Sabdariffa from Selangor, Malaysia using a combination of chromatography and spectroscopy
Yew-Keong Choong*, Nor Syaidatul Akmal Mohd Yousof, Jamia Azdina Jamal and Mohd Isa Wasiman
Published: 30 July, 2019 | Volume 3 - Issue 2 | Pages: 067-075
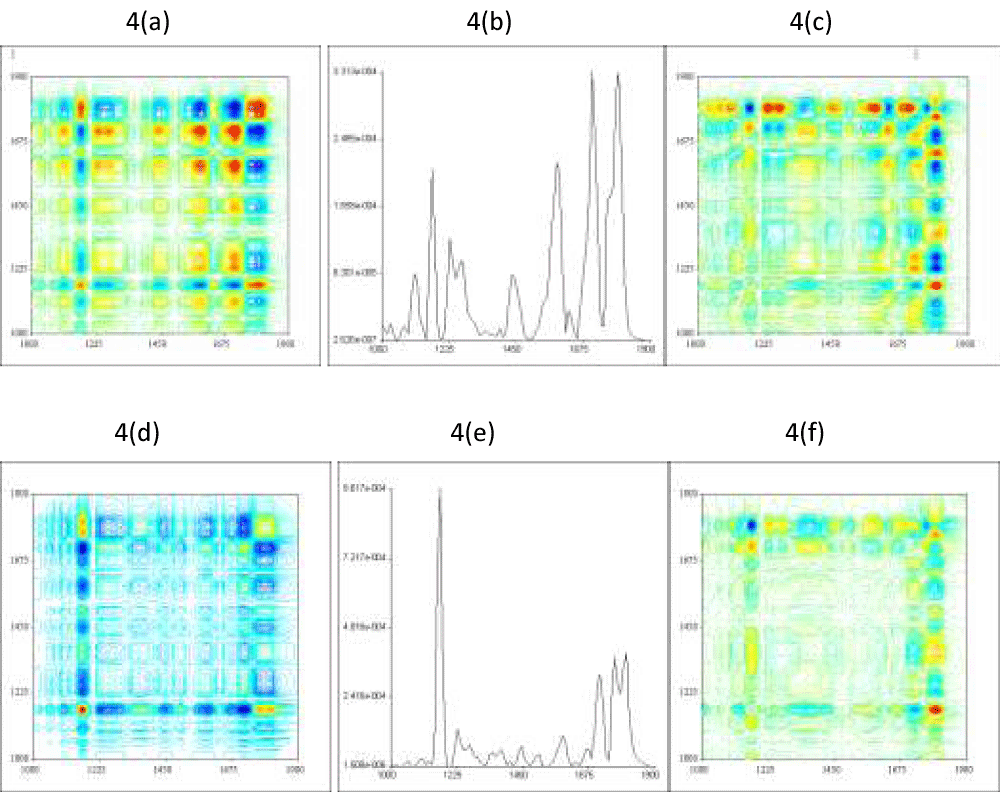
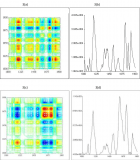
Figure 4:
(4a) showed the 2DIR synchronous spectrum of FT11-15A aqueous extract+ TFA in the range of 1900-1000 cm-1; (4b) its auto peak spectrum and (4c) the 2DIR asynchronous spectrum of FT11-15A aqueous extract+TFA in the same range. (4d) showed the 2DIR synchronous spectrum of FT11-15B aqueous extract +TFA in the range of 1900-1000 cm-1; (4e) its auto peak spectrum and (4f) the 2DIR asynchronous spectrum of FT11-15B aqueous extract +TFA in the same range.
Read Full Article HTML DOI: 10.29328/journal.jpsp.1001034 Cite this Article Read Full Article PDF
More Images
Similar Articles
-
Determination of anthocyanin content in two varieties of Hibiscus Sabdariffa from Selangor, Malaysia using a combination of chromatography and spectroscopyYew-Keong Choong*,Nor Syaidatul Akmal Mohd Yousof,Jamia Azdina Jamal,Mohd Isa Wasiman. Determination of anthocyanin content in two varieties of Hibiscus Sabdariffa from Selangor, Malaysia using a combination of chromatography and spectroscopy. . 2019 doi: 10.29328/journal.jpsp.1001034; 3: 067-075
Recently Viewed
-
Theory and Experiments. (+) Add Reading Glasses to Prevent MyopiaPeter R Greene*,Brown OS. Theory and Experiments. (+) Add Reading Glasses to Prevent Myopia . Int J Clin Exp Ophthalmol. 2017: doi: 10.29328/journal.hceo.1001002; 1: 009-022
-
Management of hypertension in Nigeria: The barriers and challengesNelson I Oguanobi*. Management of hypertension in Nigeria: The barriers and challenges. J Cardiol Cardiovasc Med. 2021: doi: 10.29328/journal.jccm.1001112; 6: 023-025
-
Chemotherapy-induced Peripheral Neuropathy: A Mini-review of Current & Developmental TreatmentsRobert Freeze, Scott Scarneo*. Chemotherapy-induced Peripheral Neuropathy: A Mini-review of Current & Developmental Treatments. J Neurosci Neurol Disord. 2024: doi: 10.29328/journal.jnnd.1001093; 8: 020-023
-
Mechanism of Small Molecule Inhibitors of PhagocytosisMelika Loriamini, Melissa M Lewis-Bakker, Beth Binnington, Lakshmi P Kotra, Donald R Branch*. Mechanism of Small Molecule Inhibitors of Phagocytosis. J Hematol Clin Res. 2023: doi: 10.29328/journal.jhcr.1001022; 7: 011-014
-
Advances in Physiological Research: Consideration on Arterial Hypercapnia in Acute Cardiogenic Pulmonary Edema (ACPE)Andrea Bellone*. Advances in Physiological Research: Consideration on Arterial Hypercapnia in Acute Cardiogenic Pulmonary Edema (ACPE). Arch Case Rep. 2024: doi: 10.29328/journal.acr.1001108; 8: 116-117
Most Viewed
-
Evaluation of Biostimulants Based on Recovered Protein Hydrolysates from Animal By-products as Plant Growth EnhancersH Pérez-Aguilar*, M Lacruz-Asaro, F Arán-Ais. Evaluation of Biostimulants Based on Recovered Protein Hydrolysates from Animal By-products as Plant Growth Enhancers. J Plant Sci Phytopathol. 2023 doi: 10.29328/journal.jpsp.1001104; 7: 042-047
-
Sinonasal Myxoma Extending into the Orbit in a 4-Year Old: A Case PresentationJulian A Purrinos*, Ramzi Younis. Sinonasal Myxoma Extending into the Orbit in a 4-Year Old: A Case Presentation. Arch Case Rep. 2024 doi: 10.29328/journal.acr.1001099; 8: 075-077
-
Feasibility study of magnetic sensing for detecting single-neuron action potentialsDenis Tonini,Kai Wu,Renata Saha,Jian-Ping Wang*. Feasibility study of magnetic sensing for detecting single-neuron action potentials. Ann Biomed Sci Eng. 2022 doi: 10.29328/journal.abse.1001018; 6: 019-029
-
Physical activity can change the physiological and psychological circumstances during COVID-19 pandemic: A narrative reviewKhashayar Maroufi*. Physical activity can change the physiological and psychological circumstances during COVID-19 pandemic: A narrative review. J Sports Med Ther. 2021 doi: 10.29328/journal.jsmt.1001051; 6: 001-007
-
Pediatric Dysgerminoma: Unveiling a Rare Ovarian TumorFaten Limaiem*, Khalil Saffar, Ahmed Halouani. Pediatric Dysgerminoma: Unveiling a Rare Ovarian Tumor. Arch Case Rep. 2024 doi: 10.29328/journal.acr.1001087; 8: 010-013

HSPI: We're glad you're here. Please click "create a new Query" if you are a new visitor to our website and need further information from us.
If you are already a member of our network and need to keep track of any developments regarding a question you have already submitted, click "take me to my Query."


