Figure 3
Pathogen identification and control of sooty spot caused by Cladosporium ramotenellum, appearing on fresh easy peeler mandarins from Perú
Celia Murciano*, Benito Orihuel-Iranzo and Jeniffer J Oliver-Chirito
Published: 09 June, 2021 | Volume 5 - Issue 2 | Pages: 044-052
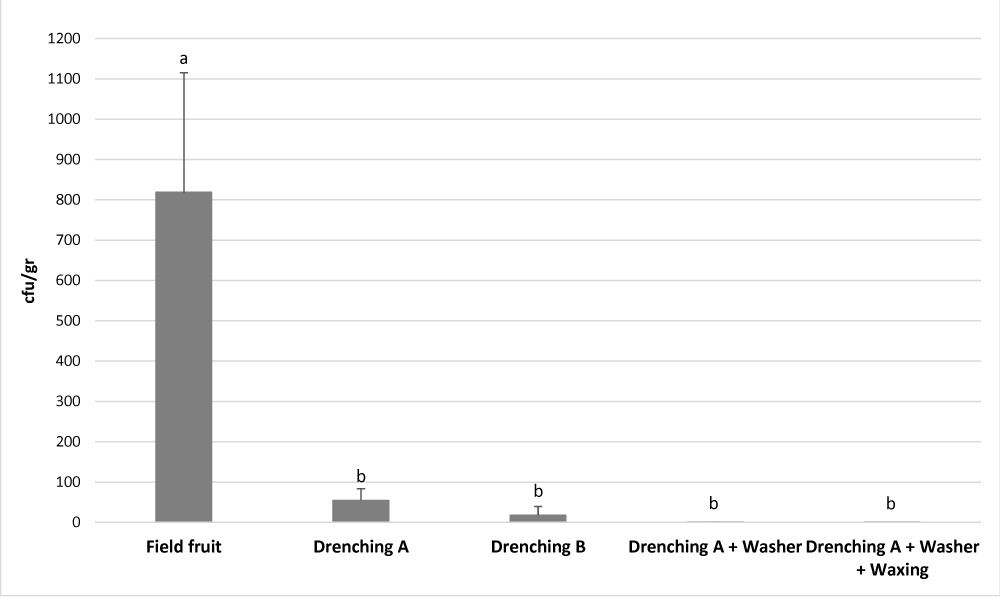
Figure 3:
Effect of postharvest treatments on the Cladosporium sp. load on the fruit surface. Cfu/gr was quantified in 10 randomly selected fruits after each postharvest treatment, and it is expressed as the mean number of cfu/gr ± standard deviation. Different letters denote significant differences (p < 0.05) among postharvest treatments.
Read Full Article HTML DOI: 10.29328/journal.jpsp.1001059 Cite this Article Read Full Article PDF
More Images
Similar Articles
-
HBV: Genomic Structure, HBVsAg Isolation and innovative Virotherapy Initiation in the Middle EastAboul-Ata E Aboul-Ata*,Essam M Janahi,I M El-Kalamawy,Kathleen Hefferon,Amal Mahmoud. HBV: Genomic Structure, HBVsAg Isolation and innovative Virotherapy Initiation in the Middle East . . 2017 doi: 10.29328/journal.jpsp.1001007; 1: 059-061
-
Control of phytopathogenic microorganisms of post-harvest in tomato (Lycopersicon esculentum Mill.) with the use of citrus extractRueda Puente Edgar Omar*,Ruíz-Alvarado Cristina,Juan José Reyes-Pérez,Hernández-Montiel Luis Guillermo,Amador Bernardo. Control of phytopathogenic microorganisms of post-harvest in tomato (Lycopersicon esculentum Mill.) with the use of citrus extract. . 2018 doi: 10.29328/journal.jpsp.1001018; 2: 037-043
-
Detection of Clavibacter michiganensis subsp. michiganensis in tomato and chili seeds and farming area of Sinaloa, MexicoRuiz Alvarado Cristina*,Soto Ortiz Roberto,Cervantes Diaz Lourdes,Nuñez Ramirez Fidel,Celaya-Michel Hernán,Rueda Puente Edgar O. Detection of Clavibacter michiganensis subsp. michiganensis in tomato and chili seeds and farming area of Sinaloa, Mexico. . 2018 doi: 10.29328/journal.jpsp.1001019; 2: 044-054
-
Assessing the stand size of bay trees (Persea spp.) after exposure to laurel wilt disease in a North Florida PreserveAnthony M Rossi*,Christopher Bentzien . Assessing the stand size of bay trees (Persea spp.) after exposure to laurel wilt disease in a North Florida Preserve. . 2019 doi: 10.29328/journal.jpsp.1001030; 3: 042-049
-
Non-chemical control of Armillaria mellea infection of Prunus persicaJim Downer*,Ben Faber. Non-chemical control of Armillaria mellea infection of Prunus persica. . 2019 doi: 10.29328/journal.jpsp.1001031; 3: 050-055
-
Causal agents of Post-harvest Rot of Pumpkin (Cucurbita pepo L.) and their control using Indigenous Practices in Hong, Adamawa StateAnjili SM*,Kazi N,Chimbekujwo IB. Causal agents of Post-harvest Rot of Pumpkin (Cucurbita pepo L.) and their control using Indigenous Practices in Hong, Adamawa State. . 2019 doi: 10.29328/journal.jpsp.1001033; 3: 062-066
-
Effect of Khaya Senegalensis Bark and Oil on Post-Harvest Fungal Agents of Groundnut Seeds Rot in Adamawa State, NigeriaChannya FK*,Asama P,Anjili SM . Effect of Khaya Senegalensis Bark and Oil on Post-Harvest Fungal Agents of Groundnut Seeds Rot in Adamawa State, Nigeria. . 2019 doi: 10.29328/journal.jpsp.1001035; 3: 076-080
-
Serological and molecular characterization of two seed born cowpea mosaic Comovirus isolates affecting cowpea plants (Vigna unguiculata L.) in northern EgyptMahmoud Hamdy Abd El-Aziz*,Hosny Aly Younes. Serological and molecular characterization of two seed born cowpea mosaic Comovirus isolates affecting cowpea plants (Vigna unguiculata L.) in northern Egypt. . 2019 doi: 10.29328/journal.jpsp.1001037; 3: 086-094
-
Nematicidal effect of abamectin, boron, chitosan, hydrogen peroxide and Bacillus thuringiensis against citrus nematode on Valencia orangSherin FA Awd Allah*,Sandy E Hammad,MAM El-Saedy. Nematicidal effect of abamectin, boron, chitosan, hydrogen peroxide and Bacillus thuringiensis against citrus nematode on Valencia orang. . 2019 doi: 10.29328/journal.jpsp.1001041; 3: 111-117
-
In vitro and preventative field evaluations of potential biological control agents and synthetic fungicides for control of Clarireedia jacksonii sp. nov.Robert A Kerr*,Jeffery W Marvin,Lambert B McCarty,William C Bridges,S Bruce Martin,Christina E Wells. In vitro and preventative field evaluations of potential biological control agents and synthetic fungicides for control of Clarireedia jacksonii sp. nov.. . 2020 doi: 10.29328/journal.jpsp.1001043; 4: 001-008
Recently Viewed
-
Minimising Carbon Footprint in Anaesthesia PracticeNisha Gandhi and Abinav Sarvesh SPS*. Minimising Carbon Footprint in Anaesthesia Practice. Int J Clin Anesth Res. 2024: doi: 10.29328/journal.ijcar.1001025; 8: 005-007
-
On Friedman equation, quadratic laws and the geometry of our universeS Kalimuthu*. On Friedman equation, quadratic laws and the geometry of our universe. Int J Phys Res Appl. 2021: doi: 10.29328/journal.ijpra.1001041; 4: 048-050
-
Texture of Thin Films of Aluminum Nitride Produced by Magnetron SputteringStrunin Vladimir Ivanovich,Baranova Larisa Vasilievna*,Baisova Bibigul Tulegenovna. Texture of Thin Films of Aluminum Nitride Produced by Magnetron Sputtering. Int J Phys Res Appl. 2025: doi: 10.29328/journal.ijpra.1001106; 8: 013-016
-
KYAMOS Software - Mini Review on the Computer-Aided Engineering IndustryAntonis Papadakis*,Sofia Nikolaidou. KYAMOS Software - Mini Review on the Computer-Aided Engineering Industry. Int J Phys Res Appl. 2025: doi: 10.29328/journal.ijpra.1001105; 8: 010-012
-
The Theory of ElementsAbdellah El-Mourabet*. The Theory of Elements. Int J Phys Res Appl. 2025: doi: 10.29328/journal.ijpra.1001104; 8: 001-009
Most Viewed
-
Evaluation of Biostimulants Based on Recovered Protein Hydrolysates from Animal By-products as Plant Growth EnhancersH Pérez-Aguilar*, M Lacruz-Asaro, F Arán-Ais. Evaluation of Biostimulants Based on Recovered Protein Hydrolysates from Animal By-products as Plant Growth Enhancers. J Plant Sci Phytopathol. 2023 doi: 10.29328/journal.jpsp.1001104; 7: 042-047
-
Sinonasal Myxoma Extending into the Orbit in a 4-Year Old: A Case PresentationJulian A Purrinos*, Ramzi Younis. Sinonasal Myxoma Extending into the Orbit in a 4-Year Old: A Case Presentation. Arch Case Rep. 2024 doi: 10.29328/journal.acr.1001099; 8: 075-077
-
Feasibility study of magnetic sensing for detecting single-neuron action potentialsDenis Tonini,Kai Wu,Renata Saha,Jian-Ping Wang*. Feasibility study of magnetic sensing for detecting single-neuron action potentials. Ann Biomed Sci Eng. 2022 doi: 10.29328/journal.abse.1001018; 6: 019-029
-
Pediatric Dysgerminoma: Unveiling a Rare Ovarian TumorFaten Limaiem*, Khalil Saffar, Ahmed Halouani. Pediatric Dysgerminoma: Unveiling a Rare Ovarian Tumor. Arch Case Rep. 2024 doi: 10.29328/journal.acr.1001087; 8: 010-013
-
Physical activity can change the physiological and psychological circumstances during COVID-19 pandemic: A narrative reviewKhashayar Maroufi*. Physical activity can change the physiological and psychological circumstances during COVID-19 pandemic: A narrative review. J Sports Med Ther. 2021 doi: 10.29328/journal.jsmt.1001051; 6: 001-007

HSPI: We're glad you're here. Please click "create a new Query" if you are a new visitor to our website and need further information from us.
If you are already a member of our network and need to keep track of any developments regarding a question you have already submitted, click "take me to my Query."


