Figure 6
Analysis of Microbial Diversity and Community Structure in the Rhizosphere of Cigar Tobacco in Different Agroecological Zones
Junru Shen, Guoyou He, Xubing Tang*, Longhui Ren, Bao Fang, Anzhong Zhen, Tao Yang* and Chuisi Kong*
Published: 13 September, 2023 | Volume 7 - Issue 3 | Pages: 097-106

Figure 6:
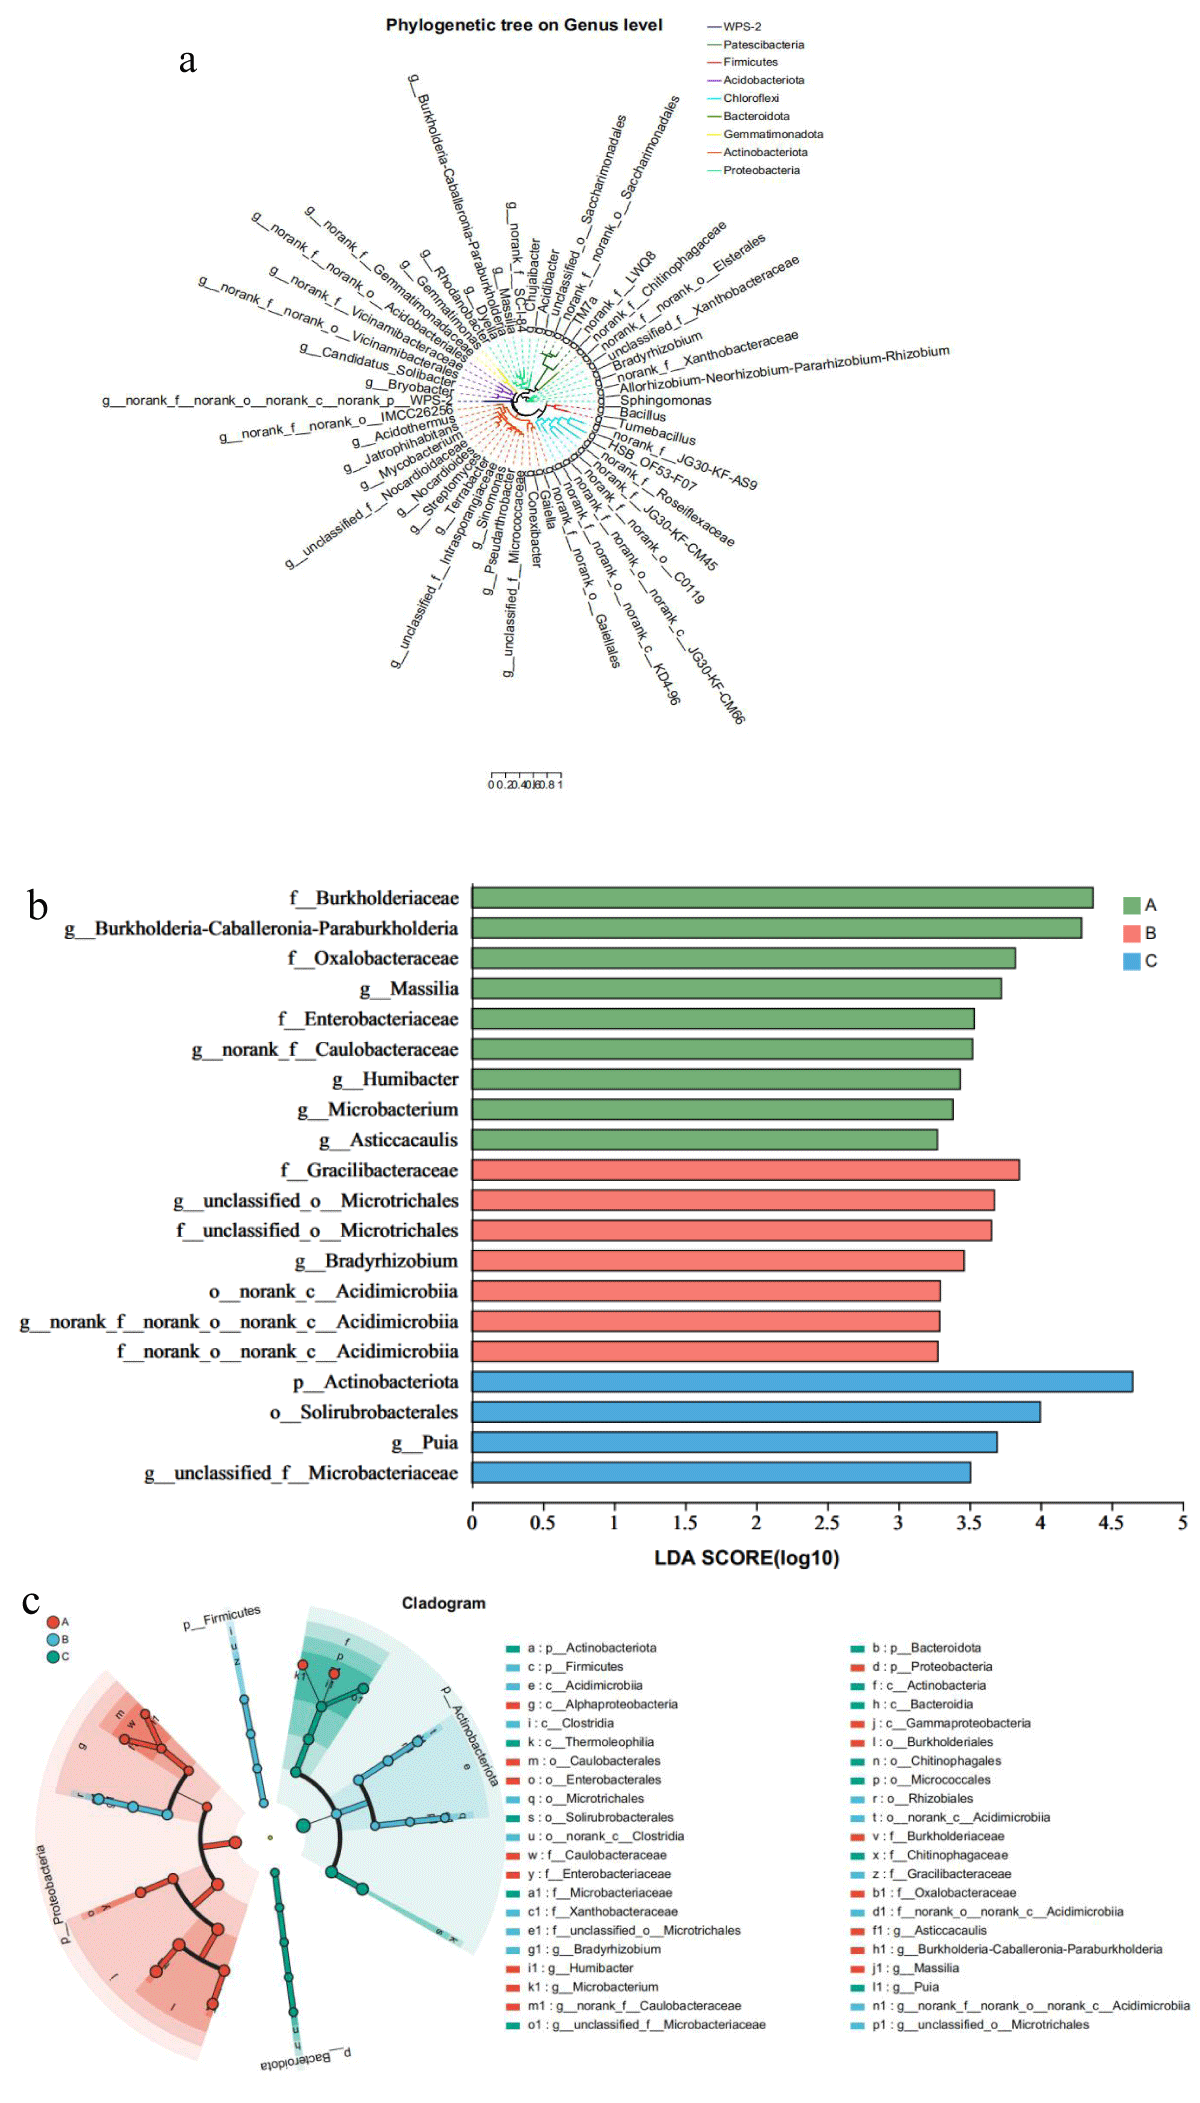
Figure 6: Comparison of microorganisms and bacteria in the rhizosphere of cigar tobacco in different Ecoregions a Cladogram of 50 microbes (mean relative abundance) based on taxonomy. (b) LDA scores of biomarker bacteria for each combination of cigar sites. LDA scores are shown as horizontal bars for the biomarker fungal with an LDA score > 4.8 as listed on the left, Kruskal–Wallis rank sum test, p < 0.05. LDA, linear discriminant analysis. (c) LEfSe analysis revealed distinct taxa of cigar tobacco rhizosphere bacteria in different Ecoregions. Areas of different colors represent different components (red for Ecoregion 1, green for Ecoregion 2, green for Ecoregion 3). The diameter of each circle is proportional to the relative abundance of the taxa, and the inner circle to the outer ring corresponds to the phylum to the genus layer.
Read Full Article HTML DOI: 10.29328/journal.jpsp.1001113 Cite this Article Read Full Article PDF
More Images
Similar Articles
-
Isolation and biochemical characterization of Plant Growth Promoting (PGP) bacteria colonizing the rhizosphere of Tef crop during the seedling stageZerihun Tsegaye*,Birhanu Gizaw,Genene Tefera,Adey Feleke,Solomon Chaniyalew,Tesfaye Alemu,Fasil Assefa . Isolation and biochemical characterization of Plant Growth Promoting (PGP) bacteria colonizing the rhizosphere of Tef crop during the seedling stage. . 2019 doi: 10.29328/journal.jpsp.1001027; 3: 013-027
-
Analysis of Microbial Diversity and Community Structure in the Rhizosphere of Cigar Tobacco in Different Agroecological ZonesJunru Shen, Guoyou He, Xubing Tang*, Longhui Ren, Bao Fang, Anzhong Zhen, Tao Yang*, Chuisi Kong*. Analysis of Microbial Diversity and Community Structure in the Rhizosphere of Cigar Tobacco in Different Agroecological Zones. . 2023 doi: 10.29328/journal.jpsp.1001113; 7: 097-106
Recently Viewed
-
Theory and Experiments. (+) Add Reading Glasses to Prevent MyopiaPeter R Greene*,Brown OS. Theory and Experiments. (+) Add Reading Glasses to Prevent Myopia . Int J Clin Exp Ophthalmol. 2017: doi: 10.29328/journal.hceo.1001002; 1: 009-022
-
Management of hypertension in Nigeria: The barriers and challengesNelson I Oguanobi*. Management of hypertension in Nigeria: The barriers and challenges. J Cardiol Cardiovasc Med. 2021: doi: 10.29328/journal.jccm.1001112; 6: 023-025
-
Chemotherapy-induced Peripheral Neuropathy: A Mini-review of Current & Developmental TreatmentsRobert Freeze, Scott Scarneo*. Chemotherapy-induced Peripheral Neuropathy: A Mini-review of Current & Developmental Treatments. J Neurosci Neurol Disord. 2024: doi: 10.29328/journal.jnnd.1001093; 8: 020-023
-
Mechanism of Small Molecule Inhibitors of PhagocytosisMelika Loriamini, Melissa M Lewis-Bakker, Beth Binnington, Lakshmi P Kotra, Donald R Branch*. Mechanism of Small Molecule Inhibitors of Phagocytosis. J Hematol Clin Res. 2023: doi: 10.29328/journal.jhcr.1001022; 7: 011-014
-
Advances in Physiological Research: Consideration on Arterial Hypercapnia in Acute Cardiogenic Pulmonary Edema (ACPE)Andrea Bellone*. Advances in Physiological Research: Consideration on Arterial Hypercapnia in Acute Cardiogenic Pulmonary Edema (ACPE). Arch Case Rep. 2024: doi: 10.29328/journal.acr.1001108; 8: 116-117
Most Viewed
-
Evaluation of Biostimulants Based on Recovered Protein Hydrolysates from Animal By-products as Plant Growth EnhancersH Pérez-Aguilar*, M Lacruz-Asaro, F Arán-Ais. Evaluation of Biostimulants Based on Recovered Protein Hydrolysates from Animal By-products as Plant Growth Enhancers. J Plant Sci Phytopathol. 2023 doi: 10.29328/journal.jpsp.1001104; 7: 042-047
-
Sinonasal Myxoma Extending into the Orbit in a 4-Year Old: A Case PresentationJulian A Purrinos*, Ramzi Younis. Sinonasal Myxoma Extending into the Orbit in a 4-Year Old: A Case Presentation. Arch Case Rep. 2024 doi: 10.29328/journal.acr.1001099; 8: 075-077
-
Feasibility study of magnetic sensing for detecting single-neuron action potentialsDenis Tonini,Kai Wu,Renata Saha,Jian-Ping Wang*. Feasibility study of magnetic sensing for detecting single-neuron action potentials. Ann Biomed Sci Eng. 2022 doi: 10.29328/journal.abse.1001018; 6: 019-029
-
Physical activity can change the physiological and psychological circumstances during COVID-19 pandemic: A narrative reviewKhashayar Maroufi*. Physical activity can change the physiological and psychological circumstances during COVID-19 pandemic: A narrative review. J Sports Med Ther. 2021 doi: 10.29328/journal.jsmt.1001051; 6: 001-007
-
Pediatric Dysgerminoma: Unveiling a Rare Ovarian TumorFaten Limaiem*, Khalil Saffar, Ahmed Halouani. Pediatric Dysgerminoma: Unveiling a Rare Ovarian Tumor. Arch Case Rep. 2024 doi: 10.29328/journal.acr.1001087; 8: 010-013

HSPI: We're glad you're here. Please click "create a new Query" if you are a new visitor to our website and need further information from us.
If you are already a member of our network and need to keep track of any developments regarding a question you have already submitted, click "take me to my Query."


